Data Flip: Transforming an Example Power BI Report

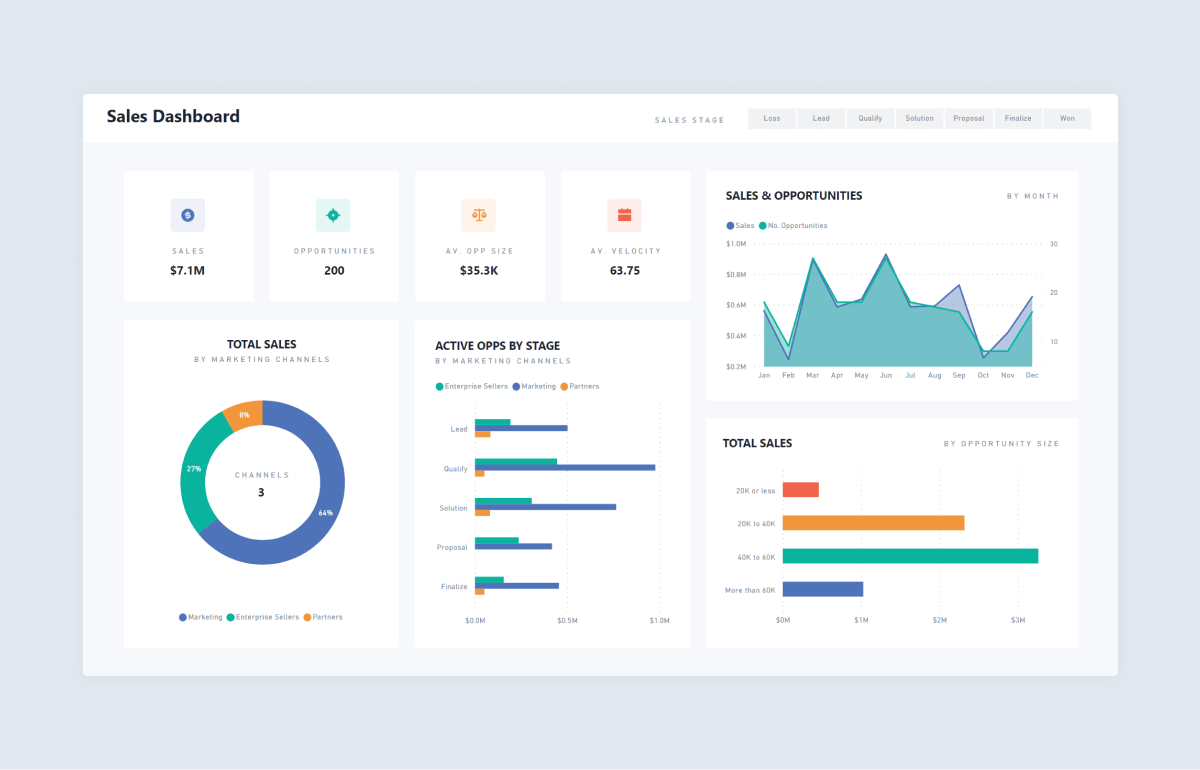
A Data Flip in Power BI involves restructuring data to gain fresh insights, optimize visualization, and enhance decision-making. Suppose you have an Example Power BI Report tracking sales performance across different regions. Instead of viewing data in a traditional table format, a Data Flip could involve converting it into interactive visualizations such as heatmaps, clustered bar charts, or dynamic slicers.
For instance, if your report displays monthly revenue by region, flipping the data to focus on customer segmentation — such as new vs. returning customers — can uncover purchasing patterns. Another approach could involve switching from aggregated sales figures to a trend-based line chart, helping stakeholders analyze growth over time.
Additionally, integrating AI-powered insights like Power BI’s Key Influencers Visual can help identify key factors driving sales. Instead of just reporting historical data, a forecasting model can predict future sales trends. A Data Flip could also involve leveraging drill-through pages, allowing users to explore product-specific performance instead of viewing only high-level data.
Ultimately, a Data Flip in Power BI enhances the usability of reports, making them more intuitive, insightful, and actionable for data-driven decision-making. Transform your Power BI reports today!
- Education
- Course
- Books
- Drawing
- Question
- Film
- Fitness
- Food
- Games
- Gardening
- Health
- Home
- Literature
- Music
- Networking
- Other
- Programming
- Religion
- Shopping
- Sports
- Curriculm
- Wellness


